Get answers for the most frequently asked questions about the Enginius segmentation module. For a quick overview, we suggest you check the introductory video first.

Segmentation and classification are analytic techniques that help firms compare and group customers who share common characteristics (i.e., segmentation variables) into homogeneous segments and identify ways to target particular segments of customers in a market based on external variables (i.e., discriminant variables).
Segmentation refers to the process of classifying customers into homogeneous groups (segments), such that each group of customers shares enough characteristics in common to make it viable for the firm to design specific offerings or products for it.
This application identifies customer segments using needs-based variables called basis variables.


To download the Enginius tutorial in pdf format: (1) Follow the link below. It will open an example data set, then (2) Click on the link in the upper-left corner of the screen.
Segmentation tutorial (3:44):
What better way to demonstrate the power of segmentation to your students than by asking them to answer a few questions online, and by running a segmentation analysis on their own data? This tutorial video shows you all the required steps, using Google Form.
Segmentation variables measure those factors that are central in determining the similarity between two respondents.
Those variables serve as the basis for segmentation and are often called basis variables. They might include customer’s needs, wants, expectations, or preferences.
Discriminant variables, also called descriptors, are variables that can describe the segments formed based on the segmentation variables.
These include demographic variables, such as educational level, gender, income, media consumption, and the like. In a good segmentation, knowledge of the descriptor or discriminant variables can predict the respondents’ segment (as calculated from the basis variables).
Segmentation will compute a “distance” (a similarity index) between the different customers you are trying to segment, and will cluster most similar customers first.
That distance is computed on the differences observed between the segmentation variables. If these variables are measured on widely different scales, however, distances will be distorted. For instance, if X1 is measured on a scale from 0 to 1, and X2 is measured on a scale from 0 to 100, then X2 will have 100 times more impact on these distance computations than X1 will.
In other words, customers will mostly be segmented based on the similarities observed along X2, whereas similarities along X1 will be mostly neglected.
In short, when segmentation variables do not use the same scales, you need to standardize your data before segmenting it, otherwise, results will be biased, and some segmentation variables (those measured on the widest scales) will have an undue influence on the results.
When all your segmentation variables use the same scale, however, it is preferable NOT to standardize anything. The reason goes as follows:
Suppose two of your questions are on a 1-10 scale and ask respondents whether they use:
(1) emails and
(2) Instagram.
Most of your respondents will respond 9 or 10 to the first question but may answer anything between 1 and 10 to the second.
Because Enginius does not know the scales originally used, it will scale the answers so both questions fall on similar ranges, and will artificially inflate the small differences found in the first question, while reducing the impact of the large differences found in question 2. It might not impact the solution much, but why take the risk?
In short… Never standardize your data when your segmentation variables use the same scales; always do it when they use different scales, or are measured on different metrics (e.g., if you compare dollars, months, and the number of purchases).
It is usually good to start with hierarchical clustering (which builds up or breaks down the data, row by row), at least to determine the appropriate number of clusters for K-Means, which partitions the data but requires both a starting group center (centroid) and a number of clusters to get started.
There is no unique segment structure, but some solutions make more sense than others. It is a trial and error process based on using both statistical criteria and managerial criteria.
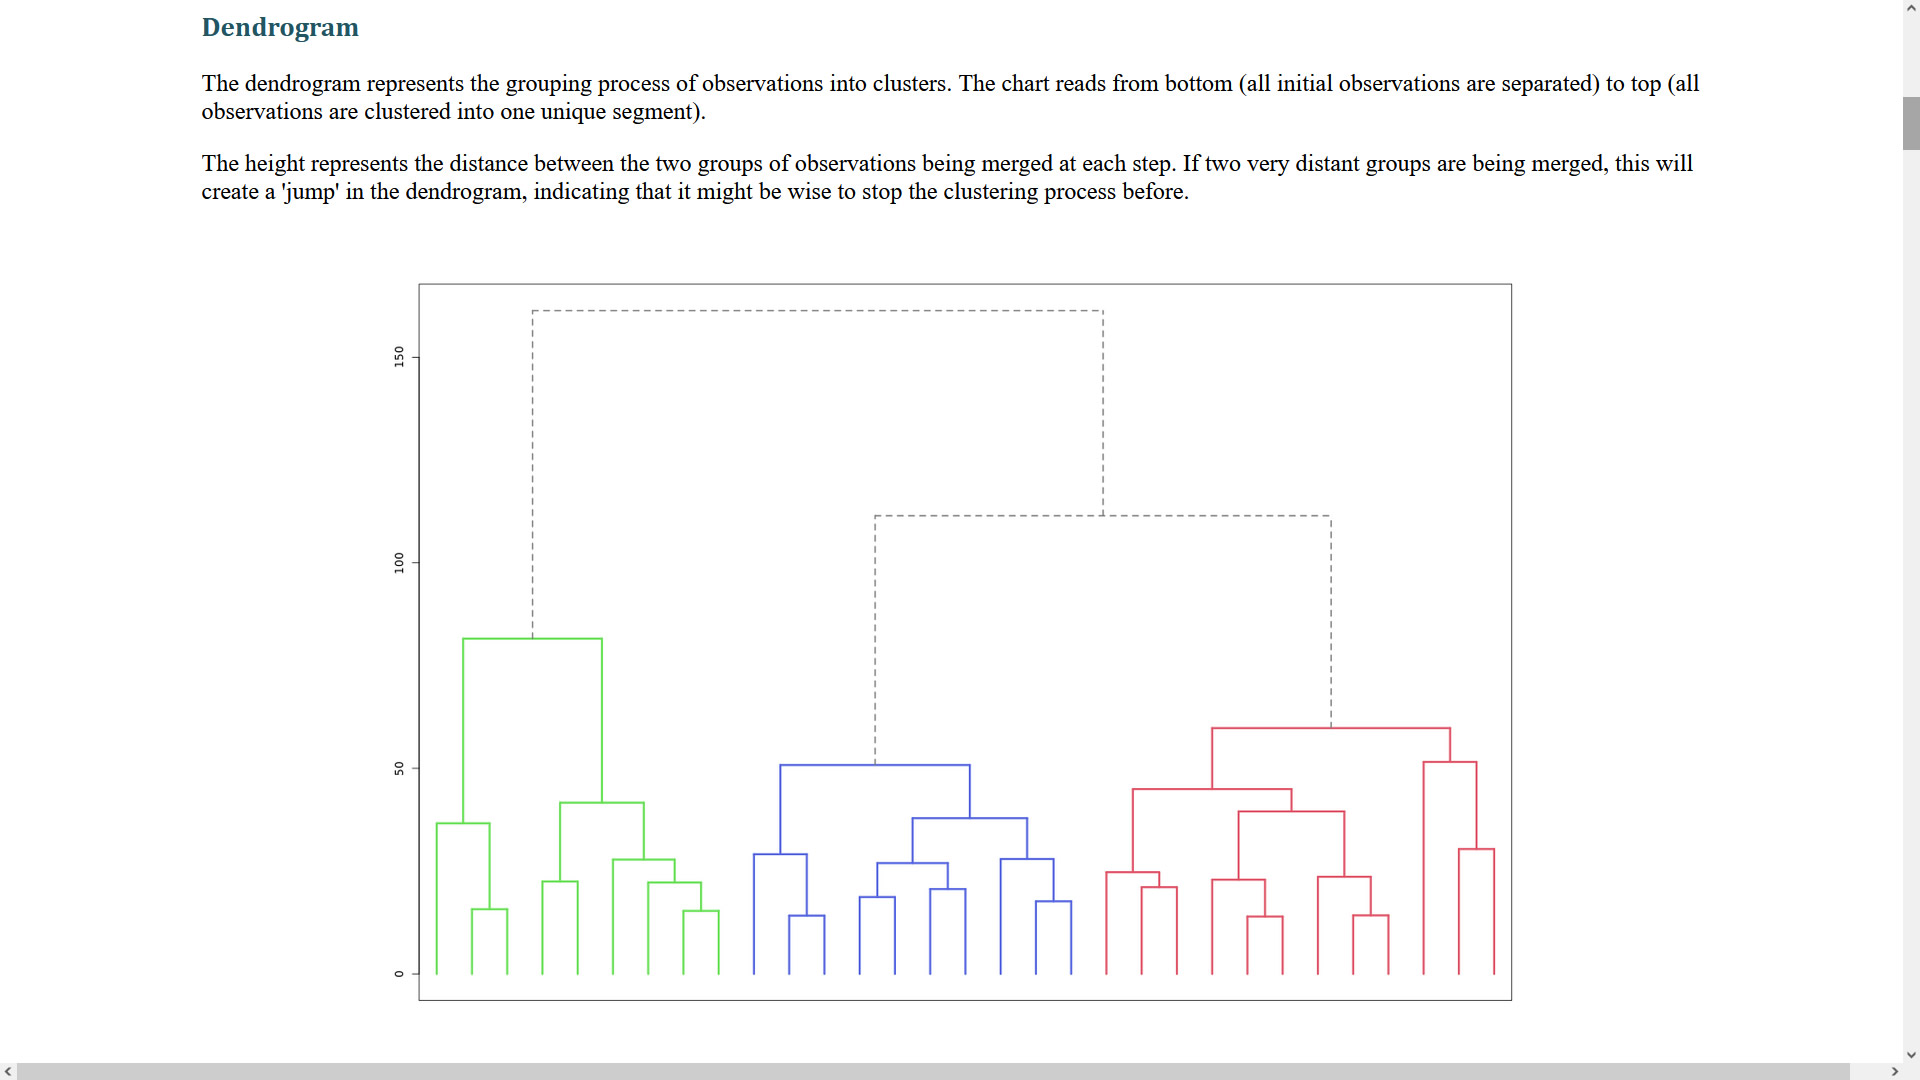
One possibility is to ask Enginius to automatically select the “best” number of segments. The software will only use statistical criteria, though, ignoring the managerial usefulness of the proposed solution. The dendrogram or elbow chart from the software output generally shows where there is no longer much to be gained in separating the data more finely. But the purpose of the segmentation will often dictate the appropriate number of clusters.
Starting from that initial solution, explore a few additional segment structures. For example, if you find that 3 clusters create with a natural break in the dendrogram, then also explore a 2-segment solution and a 4 segment solution to see if they provide better interpretability.
In summary, think about building a business case for the number of clusters:
(1) what do the data tell us and
(2) how can we implement the segmentation?
(If the purpose of the segmentation is to allocate all customers to, say, 3 sales reps, then there should be 3 segments)
Those in green are statistically significantly (at 95%) above the remaining population mean; those in red are statistically significantly (at 95%) below the remaining population mean.
The discrimination analysis tells how well descriptive data (generally available for all customers and prospects) will predict segment membership. The confusion matrix shows actual versus predicted segment membership from the discrimination. If all segments are roughly the same size, then there is one chance in n (n= number of segments) for correct classification, if there is no information in the descriptor data; that is, if the classification is done at random So, for a 4 segment solution, a good discrimination should do far better than 1/4 or 25% correct classification. In addition, high values on the diagonal of the confusion matrix indicate good classification.
© DecisionPro, Inc. 2015-2023. All rights reserved. Enginius ® is a registered trademark of DecisionPro Inc.